

The network performance considerations will not address issues regarding latency of routers since in a network system as a whole, latency per switch or router has been found to be negligible when comparing to normal workstation or PC disk access speeds and lower-speed media bandwidth considerations.
It is important to note that raw performance numbers in packets per second should never be the sole criterion for choosing any product since criteria based on support responsiveness, company financials, feature enhancements, software reliability, troubleshooting capability, and a variety of other criteria factor heavily into a final product decision. Performance of the varying platforms should be understood to determine what meets the user's requirement, allowing for future growth and expansion of a user's network.
A description of how to determine what a user's performance requirements may be follows, including some sample calculations that can then be used as a guideline and extrapolated to fit into specific network designs. The traffic patterns and network applications may not be well understood in new network designs, but it is important for some investigation to be done to determine approximate traffic patterns and worst-case scenarios (not to be misconstrued as theoretical worst-case scenarios). Next, the switching paths of varying Cisco router platforms are listed and platform aggregate numbers specified to help determine the most optimal platform in a given network design scenario. The last section of the paper lists some common features that may affect switching paths and gives general guidelines for optimum network designs.
Realities of Network Performance Criteria
The bottom line of any given network is that it becomes a medium whereby users (the people relying on the network to do their work) accomplish their jobs without incurring any noticeable delays. Performance criteria are met when every user is satisfied in terms of network responsiveness. To ensure user satisfaction, every aspect of the network must be examined, from the media to the applications to the individual devices creating the network as a whole. This task is complex.
Differentiating Performance Tests versus Real Network Performance
Three areas require classification: what comprises a performance test, how does one interpret results, and then how does one compare the results to any realistic performance requirements? The more common performance tests include blasting traffic from an input port to an output port of a device. For a given device, injecting traffic through multiple input ports to multiple output ports on the same device gives aggregate performance numbers. Usually, these tests are performed on Ethernet since Ethernet-based testers were the first available. Aggregate performance numbers are media-independent, but the type of media used plays an important role in defining what the theoretical packet-per-second limitation is. Table 1 shows characteristics of some of the more common media in use today.
| Inter-Frame Gap | Minimum Valid Frame | Maximum Valid Frame | Bandwidth | |
|---|---|---|---|---|
| Ethernet | 96 bits | 64 Bytes | 1518 Bytes | 10 Mbps |
| Token Ring | 4 bits | 32 Bytes | 16K Bytes | 16 Mbps |
| FDDI | 0 | 34 Bytes | 4500 Bytes | 100 Mbps |
| ATM | 0 | 30 Bytes (AAL5) | 16K Bytes (AAL5) | 155 Mbps |
| BRI | 0 | 24 Bytes (PPP) | 1500 Bytes (PPP) | 128 Kbps |
| PRI | 0 | 24 Bytes (PPP) | 1500 Bytes (PPP) | 1.472 Mbps |
| T1 | 0 | 14 Bytes (HDLC) | None (Theoretical)
4500 (Real) |
1.5 Mbps |
| Fast Ethernet | 96 bits | 64 Bytes | 1518 Bytes | 100 Mbps |
Bandwidth / Packet Size = Theoretical Maximum Packets per Second (where packet size may incorporate interframe gap in bits)
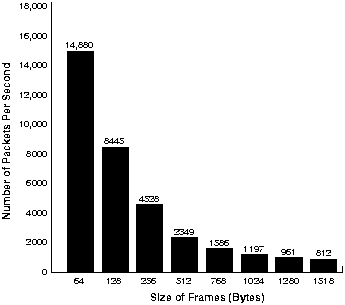
Table 2 lists the theoretical packet-per-second limitations for three common media: 10-Mb Ethernet, 16-Mb Token Ring, and FDDI, each for eight different Ethernet frame sizes. These eight frame sizes, widely used in the industry, are derived from the performance testing methodology as outlined in the Internet standard for device benchmarking in RFC1242. The numbers are derived by using the formula.
| Ethernet Size (bytes) | 10-Mb Ethernet (pps) | 16-Mb Token Ring (pps) | FDDI (pps) |
|---|---|---|---|
| 64 | 14880 | 24691 | 152439 |
| 128 | 8445 | 13793 | 85616 |
| 256 | 4528 | 7326 | 45620 |
| 512 | 2349 | 3780 | 23585 |
| 768 | 1586 | 2547 | 15903 |
| 1024 | 1197 | 1921 | 11996 |
| 1280 | 961 | 1542 | 9630 |
| 1518 | 812 | 1302 | 8138 |
The frame size needs to incorporate the data and header bytes as well as the bits used for the preamble and interframe gap, as shown in Figure 1.
Figure 1. : 10-Mb Ethernet Frames

Neither token nor idles between packets are accounted for because the theoretical minima are hard to pin down, but by using only the frame format itself the maximum theoretical packets per second can be estimated, as shown in Figure 2. Note that, since we are basing our initial frame on an Ethernet frame, we need to subtract the Ethernet header bits for the correct calculation of the data portion. So, for a 64-byte Ethernet frame, we get 64 -- 18 = 46 bytes of data for the DATA portion of the Token Ring frame shown in Figure 2.
Figure 2. : 16-Mb Token Ring Frames

Neither token nor idles between packets are accounted for because the theoretical minima are hard to pin down, but by using only the frame format itself the maximum theoretical packets per second can be estimated, as shown in Figure 3. Note that, since we are basing our initial frame on an Ethernet frame, we need to subtract the Ethernet header bits for the correct calculation of the data portion. So, for a 64-byte Ethernet frame, we get 64 -- 18 = 46 bytes of data for the DATA portion of the FDDI frame shown in Figure 3.
Figure 3. : FDDI Frames

It is important to note that as the frame size increases the maximum theoretical packets per second decrease.
Figure 4. : 10-Mb Ethernet Theoretical Performance
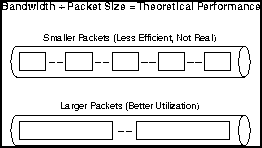
Having seen how maximum theoretical performance is determined, we now see how that data fits in with the performance requirements of real user networks. Each medium has a specific fixed-size bandwidth pipe associated with it, and each one may or may not define a minimum and maximum valid frame size. The minimum and maximum frame sizes are important because most good applications written for workstations or PCs make efficient use of bandwidth available and use maximum-sized frames. The smaller the frame size, the higher the percentage of overhead relative to user data; in other words, smaller frame sizes mean less effective bandwidth utilization. (See Figure 5.)
Figure 5. : Bandwidth Efficiency for Small versus Large Frames
An understanding of real traffic patterns is important when designing networks. At least some typical applications should be known so that the average packet sizes on the network can be determined. Sniffer traces to look at typical packet sizes for varying applications are helpful; some of the more common ones include:
We consider a very simple network, depicted in Figure 6
Figure 6. : Sample Network
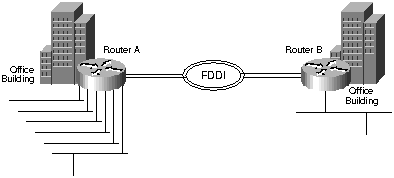
The network consists of six Ethernets that are interconnected via an FDDI backbone. Router A interconnects the Ethernet networks to the FDDI backbone. For simplicity, we assume that all the Ethernets have traffic characteristics similar to those shown in Figure 7.
Figure 7. : Graph of Typical Ethernet Network
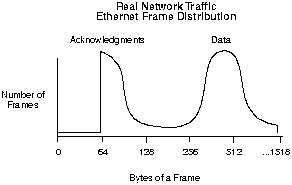
Most of the traffic falls between 256-byte and 1280-byte packets, with numerous 64-byte packets that are typically acknowledgment packets. Our calculations assume that the Ethernet network is fairly busy with average utilization at 40 percent; in other words, 4 Mbps of Ethernet bandwidth is utilized. For average traffic rates, 40-percent utilization of Ethernet bandwidth is a rather heavily utilized network since collisions are very probable and most of the traffic on the network is retransmission traffic. However, the example is intended to show a worst-case real-world performance scenario.
For simplicity, we assume that the following traffic is on the Ethernet:
Using this formula yields:
Now consider a scenario with central servers and assume that the 80/20 rule does not apply; only 10 percent of the traffic stays local and 90 percent goes through the router to the servers that are off the backbone. In this scenario, the router must support 6 x (2798 x 90%) = 15,110 pps for our example of six Ethernets. The appropriate router platform must be chosen that will meet the traffic requirements.
This example shows how the packets-per-second requirement for varying networks is computed. As will be shown in subsequent sections, all Cisco router platforms meet and greatly exceed the pure packets-per-second requirements of real networks.
Router Platform Switching Paths
This section will list the switching paths that the various router platforms support.
This category of routers includes the Cisco 2500, 4000, 4500, and 4700 series routers. The switching paths supported for these routers are process switching and fast switching. Fast switching is on by default for all protocols.
The aggregate performance numbers in packets per second are listed in Table 3.
| Switching Paths | 2500 Series | 4000 | 4500 | 4700 |
|---|---|---|---|---|
| Process Switching | 1000 | 1800 | 10,000 | 11,000 |
| Fast Switching | 6000 | 14,000 | 45,000 | 50,000 |
Features Affecting Performance
Understanding how a given feature will affect the router's switching paths is critical when designing networks. Many new features are initially incorporated into the process switching path and, in subsequent releases, incorporated into faster switching paths. The most current enhancements are listed in Cisco Connection Online (CCO) under Technical Assistance/Tech Tips: Hot Tips/IOS Information. There you will find new features for Cisco Internetwork Operating System (Cisco IOSTM) releases and any performance enhancements to previously implemented features.
Low-End and Mid-Range Router Memory Considerations
Most performance concerns arise from the need for sufficient memory to run in certain environments and the necessity to prevent overstrain on the CPU. The memory considerations are primarily issues for the low-end and midrange platforms. Product Bulletins #284 and #290 address these issues for the Cisco 4000 and 2500 series routers, respectively. They can be accessed via the Web as follows:
Additional features that most affect CPU utilizations are link-state routing protocols such as Open Shortest Path First (OSPF) and NetWare Link Services Protocol (NLSP), tunneling, access lists, accounting, layer 2 forwarding (L2F), multichassis MP, queuing, compression, and encryption.
No boilerplate mechanism to give hard-and-fast platform limitations exists. What needs to be considered is that, for any given platform, the number of interfaces you can support depends greatly on encapsulations and features used. The aggregate maximum packets per second is a useful number for approximating the maximum number of interfaces to put into a given platform as long as some real-world analysis of the traffic flow is done. If designs follow a more theoretical maximum- packets-per-second approach, the Cisco routers will be greatly underutilized.
Some common rules to follow:
Some common network designs are suboptimal in terms of performance; most of these are based on media mismatch. (See Figure 8.)
Figure 8. : Media Mismatch
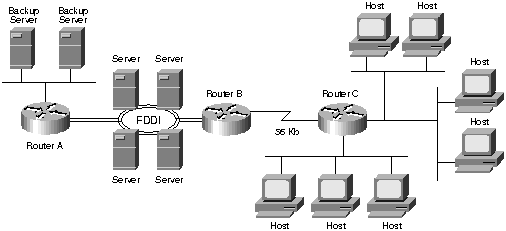
In this scenario, two separate cases of common media mismatch problems are shown. The first problem is between router B and router C where multiple clients are trying to access a centralized server farm. What may not be obvious at first glance is that the 56-Kb line is the primary connection between the clients and the servers, and it will quickly become oversubscribed with traffic. At the very least, enough bandwidth to support the maximum expected peak traffic between the clients and servers should be in place. Or, if certain Ethernet segments make extensive use of a particular server, distributing servers to local Ethernet segments will greatly improve network performance.
The second performance problem is through router A, where the server farm gets backed up to a network of backup servers. The media mismatch from 100 Mbps FDDI to 10 Mbps Ethernet is the bottleneck. To gain optimal performance for high-speed backups going through the router, the media speeds should be maximized.
Choosing the appropriate router interface media and router platform are important to designing optimized performance networks. Choose the appropriate media by understanding what average and peak traffic flows are for different points of the network. At the very least, an approximate calculation can be performed for worst case traffic scenarios. Next, the appropriate protocol feature set needs to be determined to ensure sufficient memory and CPU requirements are met. Armed with the knowledge of media interfaces, memory and CPU requirements, the appropriate router platform for a given scenario should be clear.
Click here to return to module 2, section
1.